Mapping Grassland Boundaries and Losses
Background
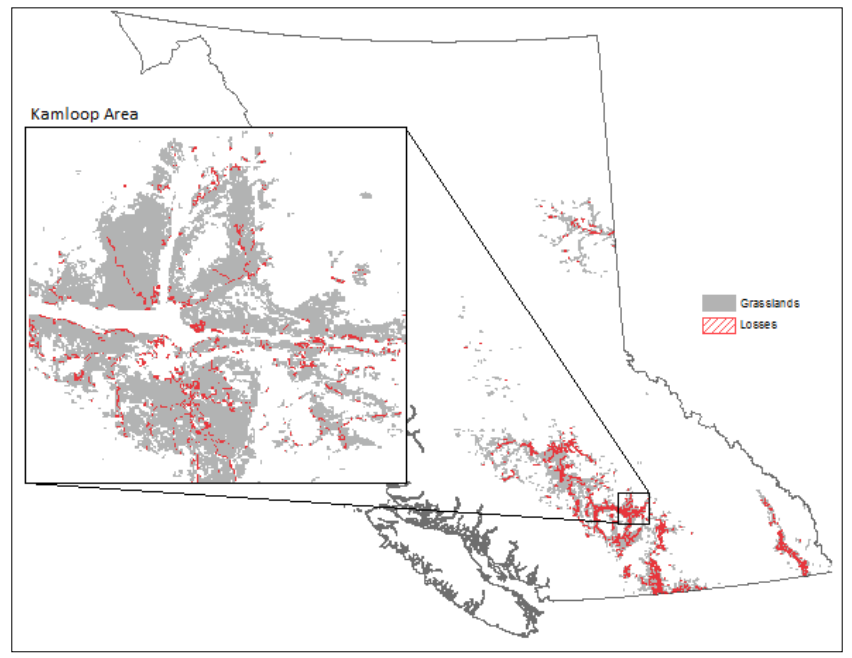
Grasslands are being rapidly lost due to human development, forest encroachment, and other threats. In 1995, the Grasslands Conservation Council of BC mapped grasslands across the province and in 2015 this mapping was updated, and a loss assessment was conducted.
While there are several regional Sensitive Ecosystem Inventories, Terrestrial Ecosystem Maps, and Predictive Ecosystem Maps, the GCC’s mapping is the only complete mapping of grasslands across BC and the only inventory of grassland losses in BC.
The dataset provides a powerful tool to lobby for increased protection, while at the same time allowing policy makers to come to informed decisions over the future of grasslands in British Columbia.
Results
In 2004, grasslands covered 0.8% (761,476 ha) of BC. Land status of the grasslands was 10.2% federal, 43,6% private, and 46.2% provincial crown land.
In 2015, 11623 separate disturbances were identified, resulting in the loss of 15330.5 ha of grasslands in British Columbia from 1995 – 2014. The development types causing the most loss were agriculture (4473 ha), minor roads (3297 ha), and acreage developments (2166 ha). Interestingly, although they resulted in large total losses, the average size of minor roads and acreage developments were the smallest at about 0.8 ha and 0.6 ha respectively. Suburb developments, and suburbs under construction were on average the largest, at 5.6 ha and 4.0 ha respectively.
Breaking the results down by BC Regional District, the Thompson-Nicola and the Okanagan Similkameen lost the greatest area of grasslands (5110 ha and 3386 ha respectively). However, the Thompson-Nicola originally had a very large area of grassland ecosystems, and thus the relative loss is small. In terms of percent of original grasslands lost, the three Okanagan Regional Districts are by far the hardest hit: the Central Okanagan lost 8.0% of its total, the North Okanagan lost 6.4%, and the Okanagan-Similkameen lost 4.2%. Most of the other districts experienced losses of less than 2%.
Data
Find the spatial layers HERE.

Map: Grasslands with areas lost (1995-2014) due to development shown in red. In the small scale portion of this map, the loss areas are exaggerated for visibility. The Kamloops area inset gives a better sense of the proportion of area lost.


